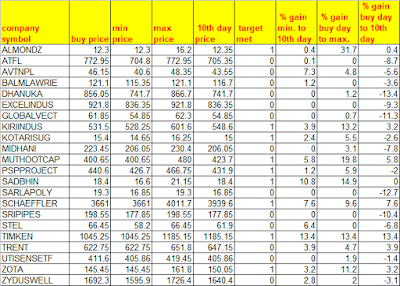
Let us review the performance of the stocks list posted based on 24th August closing. We had a total of 22 stocks in the list on that day. I will not post the same list again. That can be reviewed here.
| company symbol | buy price | min price | max price | 10th day price | target met | % gain min. to 10th day | % gain buy day to max. | % gain buy day to 10th day |
| ALMONDZ | 12.3 | 12.3 | 16.2 | 12.35 | 1 | 0.4 | 31.7 | 0.4 |
| ATFL | 772.95 | 704.8 | 772.95 | 705.35 | 0 | 0.1 | 0 | -8.7 |
| AVTNPL | 46.15 | 40.6 | 48.35 | 43.55 | 0 | 7.3 | 4.8 | -5.6 |
| BALMLAWRIE | 121.1 | 115.35 | 121.1 | 116.7 | 0 | 1.2 | 0 | -3.6 |
| DHANUKA | 856.05 | 741.7 | 866.7 | 741.7 | 0 | 0 | 1.2 | -13.4 |
| EXCELINDUS | 921.8 | 836.35 | 921.8 | 836.35 | 0 | 0 | 0 | -9.3 |
| GLOBALVECT | 61.85 | 54.85 | 62.3 | 54.85 | 0 | 0 | 0.7 | -11.3 |
| KIRIINDUS | 531.5 | 528.25 | 601.6 | 548.6 | 1 | 3.9 | 13.2 | 3.2 |
| KOTARISUG | 15.4 | 14.65 | 16.25 | 15 | 1 | 2.4 | 5.5 | -2.6 |
| MIDHANI | 223.45 | 206.05 | 230.4 | 206.05 | 0 | 0 | 3.1 | -7.8 |
| MUTHOOTCAP | 400.65 | 400.65 | 480 | 423.7 | 1 | 5.8 | 19.8 | 5.8 |
| PSPPROJECT | 440.6 | 426.7 | 466.75 | 431.9 | 1 | 1.2 | 5.9 | -2 |
| SADBHIN | 18.4 | 16.6 | 21.15 | 18.4 | 1 | 10.8 | 14.9 | 0 |
| SARLAPOLY | 19.3 | 16.85 | 19.3 | 16.85 | 0 | 0 | 0 | -12.7 |
| SCHAEFFLER | 3661 | 3661 | 4011.7 | 3939.6 | 1 | 7.6 | 9.6 | 7.6 |
| SRIPIPES | 198.55 | 177.85 | 198.55 | 177.85 | 0 | 0 | 0 | -10.4 |
| STEL | 66.45 | 58.2 | 66.45 | 61.9 | 0 | 6.4 | 0 | -6.8 |
| TIMKEN | 1045.25 | 1045.25 | 1185.15 | 1185.15 | 1 | 13.4 | 13.4 | 13.4 |
| TRENT | 622.75 | 622.75 | 651.8 | 647.15 | 0 | 3.9 | 4.7 | 3.9 |
| UTISENSETF | 411.6 | 405.86 | 419.45 | 405.86 | 0 | 0 | 1.9 | -1.4 |
| ZOTA | 145.45 | 145.45 | 161.8 | 150.05 | 1 | 3.2 | 11.2 | 3.2 |
| ZYDUSWELL | 1692.3 | 1595.9 | 1726.4 | 1640.4 | 0 | 2.8 | 2 | -3.1 |
Same table as a picture.
You can click on it to see in full size.
Analysis of Performance
Net gain on capital in scenario 1: -2.1% (loss)
Net gain on capital in scenario 2: -2.8% (loss)
Net gain on capital in scenario 3: 6.5% (gain)
Net gain on capital in scenario 4: 3.2% (gain)
For details of each scenario, you can go through the explanation given for 20th August list review.
Brokerage is not considered as it is only -0.2% to add to above values (with Zerodha broker). For day trading it can make a big difference but for positional trades we can ignore it when looking at one trade at a time.
Here again the two bad days (last Monday and Friday) being included in the 10 days period, the performance is affected. The scenario1 gain being better than that of scenario 2 means that it is better to take some gains when we feel that the broader market sentiment is turning negative. This could be difficult to know before Monday's fall. But after Monday's fall we can cut down positions in the later days seeing the small rises of Tuesday to Thursday as second chance to exit positions.
Overall it seems to indicate that simply buying all stocks from the list is not enough to close with gains after two weeks. Understanding changing sentiment can help decide to hold till 10th day or close positions on second chances.
If you liked this post, you can check any of the Reaction boxes below. If you want to post any questions or share thoughts, feel free to add comments below.
If you have any ideas to further improve the gain from this list, I would like to hear it and do a study.
Read the disclaimer on the right side of this blog (in desktop mode) before making any investment/trading decisions.

No comments:
Post a Comment