Showing posts with label moving average. Show all posts

Tuesday, July 5, 2011

Two Stocks for 2 Weeks : PAPERPROD & PETRONET

Below are two stocks I discovered through certain criteria using EOD screener on icharts.in. Both are potential candidates to rise if they cross above high of yesterday. 50 day EMA or the last day's low (whichever is closest to LTP) is a good point for stop loss.


PAPERPROD


PETRONET


Continue reading...

Sunday, March 8, 2009

Domestic Institutional Investors Just Can’t Stop Buying

If you ask any businessman about who has the money in these difficult times, he will say that the customer has the money. But if you ask me the same question to me I will say that it is the Domestic Institutional Investors (DIIs) in India that have the money. And they demonstrate it everyday by buying stocks on the Indian bourses.

good evening snow and treesImage Source

If you are wondering who these DIIs are, they are just opposite of FIIs. FIIs are foreign Institutional Investors meaning the institutional investors trading/investing stocks from other countries. Where as DIIs are the institutions within our own country. Examples are LIC, UTI bank and several public sector banks/insurance companies.

In fact these institutions get an official request from the government of India to do those transactions mainly on the buy side to support markets during the turbulent times. Turbulent times are when the markets only go down due to excessive supply from all market participants. Do not take its literal meaning the share market context.

One must have known a slang word in Telugu used to best describe these type of investors. I am just reversing it to spell it as – puluba. These investors have lot of puluba in terms of money that they keep showing it on the bourses when every individual investors on the Dalal Street has no clue as to why they behave so.

What caused this from 2004?

The story dates long back to 2004 when UPA has won elections on the back of support from the CPI or left front. UPA was formed from coalition between Congress party and left front parties. Just as the new government came into action, left front already started making comments about their plans and control over the government making reforms in the economy. This concerned investors and more on the FIIs. They started selling stocks in frenzy. That was what caused popular stock market crashes in those days on Bombay Stock Exchange.
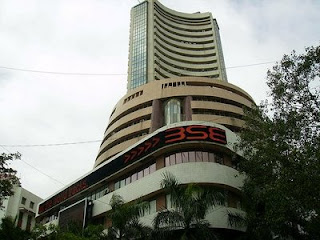
bombay stock exchangeImage Source

bombay stock exchange boardImage Source

By that time already there was a good bull market and many investors who were bullish are affected as usual. Some committed suicide and some must have staged rallies as well. Anyway that has made this government (which is still under the same administration from those times) to consider the importance supporting the market through any means. The government based institutional investors like LIC, UTI bank are the companies that are obligated to support the markets as much as they can under all technological limits.

As I get the market statistics on my mobile phone from Indiabulls (my brokerage service), I get to know the daily net transactions of DIIs and FIIs. FIIs not having any choice ended up being net sellers all of the time, while the DIIs are net buyers most of the time. This shows a definite trend which is down trend. The counter trend starts when FIIs become net buyers for more at least two consecutive days. DIIs can remain buyers or may become buyers, but that does not matter for the market direction.

Let us check our next good bet(s)

This time I changed the charts to also add the Bollinger Bands along with usual volume and moving average indicators. The chart for the Cambridge solutions shows its usual consolidation pattern in the midst of a general market meltdown. Its trend is strong as shown by the white candlesticks made every day. That may also mean that it can surge suddenly upwards on a good day or two.

cambridge solutions candlestick chart 06 march 2009Image Source

Then the chart for nifty shows that it has clearly broken the trend line and set the tone for the new down trend in the long term trend. If one wants to short the term, it is better to do it on every rise. Ha ha.. does it sound similar but opposite to traditional saying “buy on every dip”?

nifty candlestick char 06 march 2009Image Source

This time I am also featuring my most tracked exchange traded fund these days. That is the gold benchmark exchange traded scheme. Its scrip id is goldbees on NSE. It can be traded on the national stock exchange just like a stock. The chart for this shows that it just touched the support at the moving average in between the Bolliger bands. I feel that it crosses that and touches the lower Bolliger band before resuming uptrend. We cannot tell when it will do so. But we can see that 1400-1450 may be the good price to catch it to ride the next wave if there is going to be any. Many financial experts give a green signal for Gold. Then why should we ignore the opportunity when it is still one.

goldbees candlestick chart 06 march 2009Image Source

Good luck trading!


Continue reading...

Wednesday, February 25, 2009

Resuming Posting After a Long Time

I had lost touch with this blog for a long time since August. The breakdown of SELMCL coincided with lot of other things. The worst of recession has happened after that time.

September and October were the two bloody months that the world markets all together have ever witnessed. Lot of unwanted but inevitable things happened during that time. And that has set the tone or upper limit for the markets which haven’t crossed till now. I don’t think they will ever cross that limit.

beautiful beginingImage Source

I had become very busy with my daily work and couldn’t concentrate on continuing this blog. Well, there was no special incentive in maintaining this blog. It was a matter of expressing my thoughts about stock trading on a day-to-day basis. But because of overpressure in other works, I had to put a pause to it. I didn’t know how long at that time.

national stock exchange nseImage Source

Things were only getting worse and I had stopped my trading. I realized that I couldn’t trade the way I used to before. A loss was always unbearable for me and I always cut it when it is small even though painful. I never take diversification. That is a myth. It is like taking alcohol and driving a car. Feels good and safe till the accident happens.

I have learned the importance of organizing information that I had been learning with my trading. I will plan to post them over time. I have written down rules that must be strictly followed while trading. There are lots of ways to find stocks or filter them, for day trading, for trading in the morning or evening and also for short term trading. Long term trading is a phenomenon that doesn’t exist now. I don’t have any hopes for it in the future.

Coming to the present day, I noticed that my broker, Indiabulls, regularly sends an article to give a “morning brief”. This is cool to get some fresh information early in the morning. Indiabulls seems to be doing some best job for their clients.

Today’s news are not breaking news. But there is an interesting news. DLF has cut back its residential project prices by Rs. 13 Lakh in Chennai. This shows that there is a good fall in property prices in popular cities. We need to wait for more action that can spread this to all the parts of a city like the area where I live. Just be patient. That is surely going to happen.

Let us look at the chart for Nifty.

chart of nifty on 25 february 2009Image Source

There is a suggestion that there could be an unexpected uptrend after all the dancing that happened since November. The white candlestick after a “dragonfly doji” day. This is a classic followup. But still the moving average above it shows the resistance. We can safely assume that it will breakdown surely but gradually once it crosses below the magical 2500 mark. It will because the hell is going to break lose like anything we have never seen before. Don’t say not again.

Putting it aside because it is the long term trend, we can see that this time is a pause from the long term trend. These are the best days to start any venture, shift jobs, look for a new office or anything. I think this is the optimal chance. It may not come again anytime soon.

From the general statistics that I track, I checked only the stocks making 52 week high. I found one stock – “Cambridge Solutions”. It is in information technology sector. This is one of those rare, unpopular stocks like the SELMCL. But its volume is lot lesser. Putting the chart below. I think this can be the next good bet.

chart of cambridge solutions on 25 february 2009Image Source

This looks like a nice trend. It is bouncing above its moving average. But my broker may not allow me to buy the stock. There is some restriction in Indiabulls. We can only trade heavily traded or high volume stocks. That sucks, Indiabulls being the best in class brokerage service for trading on National Stock Exchange.

There may be more next good bets lurking in the shadows. It needs some effort to check the older statistics and filter them with various criteria. I will post them as I find them.

Continue reading...

Friday, August 15, 2008

The Nifty Caught at Moving Average

The Nifty is at high values and in overbought region. It tried to stay above 4600 but couldn’t stay for overheard pressure is very high. Now it is just above its 20 day moving average. It is now in a situation where its next move will clearly tell whether it has changed the trend from up to down or it deferred that to a future date.

Looking at the below chart it is clear it is behaving normally by falling every day after reaching the highest point in two months. It did like that many times in this year from January. Both the moving averages 20 day and 50day are at the same value. If you look at the right side of the chart it becomes clear that it changes trend downwards after dipping below them and making fake recovery for few days.

nifty char, national stock exchange symbol

Image Source


I cannot say anything about this routine behavior except suggesting to getting out of the markets as soon as possible.


Continue reading...